Resting-State Functional Magnetic Resonance Imaging (rsfMRI) in Attention Deficit Hyperactivity Disorder: Meta-Analysis
My Master's Thesis in General Health Psychology. A comprehensive meta-analysis of whole-brain rsfMRI studies comparing people with attention deficit hyperactivity disorder to neurotypical people.
This is my Master’s Thesis from the Master’s Program in General Health Psychology at the University of Barcelona (2019-2021 academic year), supervised by Joan Guàrdia Olmos. Translated from the original in Spanish.
Authors: Óscar Fernández-Vázquez a, Silvia Ruiz-Torras d, Maribel Peró-Cebollero abc, Joan Guàrdia-Olmos abc.
Affiliations
a Facultat de Psicologia, Secció de Psicologia Quantitativa, Universitat de Barcelona, Españab UB Institute of Complex Systems, Universitat de Barcelona, Spain
c Institute of Neuroscience, Universitat de Barcelona, Spain
d Clínica Psicològica de la Universitat de Barcelona, Fundació Josep Finestres, Universitat de Barcelona, Spain
Table of Contents
Abstract
Objective: To conduct a comprehensive meta-analysis of all resting state functional MRI (rsfMRI) studies to date comparing people with attention deficit hyperactivity disorder (ADHD) to neurotypical (NT) people.
Method: After conducting searches in a large set of databases, we included studies using the two most recent versions of the DSM or ICD, comparing ADHD to NT, and provided the results as peaks of coordinates in a standard stereotactic space with their associated significance level. We excluded studies using seed-based or functional integration analyses, and those in languages other than Spanish or English. All screening phases (by title/abstract and full text) were performed independently by two reviewers. The meta-analysis was conducted on the software SDM, establishing a threshold of an uncorrected p < ,005.
Results: We included 10 studies comprising 641 participants, all of them children. We found 3 significant peaks. Two peaks indicated hyperactivation (ADHD > NT) in the left paracentral lobule (SDM-Z = 3,112; p = ,0009; 75 voxels) and the corpus callosum (SDM-Z = 2,886; p = ,0019; 25 voxels), and one, more significant, hypoactivation peak (ADHD < NT) in the right cerebellum (SDM-Z = -3,683; p = ,0001; 543 voxels). The low number of included studies didn’t allow for heterogeneity analyses. The quality of the studies is moderately high and the risk of bias for the most significant peak appears to be low.
Conclusions: This meta-analysis contributes to the growing field of neuroimaging in psychological disorders. We have identified significant alterations in the cerebellum, a region involved in neuropsychological processes that are impaired in ADHD. Our results should guide future neuroimaging studies in this field.
Acknowledgements
To Joan Guàrdia for sparking my interest in statistics in general and meta-analyses in particular. For his rigor, enthusiasm, critique, and encouragement.
To Maribel Peró for giving me a solid foundation on methodology, for her honesty, assistance, supervision, and guidance.
To Silvia Ruiz for her invaluable contributions throughout the entire process, for her encouragement and her tireless enthusiasm.
To Cristina Cañete for her generosity, patience, and help.
To Pablo Peinado for his constant support and valuable feedback.
To Juan Pablo Sanabria for his excellent recommendations on how to efficently coordinate a meta-analysis.
To Alexandra Elbakyan for her pivotal role in promoting global science and championing the emancipation and democratisation of knowledge.
Introduction
Attention Deficit Hyperactivity Disorder (ADHD) is a neurodevelopmental disorder characterised by a persistent pattern of inattention and/or hyperactivity-impulsivity that interferes with an individual’s functioning or development (APA, 2013).
The most recent meta-analyses report a global prevalence between 5.29% (Polanczyk et al., 2014) and 7.2% (Thomas et al., 2015). Data from a recent epidemiological study with a sample of 1,104 Catalan children aged 3 to 6 years, by Canals et al. (2018), aligns with this range; they found a prevalence of ADHD of 5.4%. Generally, literature reports a higher prevalence in males than females, with a varying ratio between 1.6:1 (Fayyad et al., 2017) and 10:1 (Jiménez et al., 2012, as cited in Canals et al., 2016). The ratio is likely closer to 2.45:1, based on meta-analytic studies with community samples (Polanczyk and Jensen, 2008).
In the early stages of development, ADHD already significantly affects academic performance and family health (Canals et al., 2018). Although symptoms tend to decrease with age, meta-analyses of longitudinal follow-up studies of children with ADHD indicate that at least 15% still meet the diagnostic criteria at 25 years old, and approximately 40-60% meet the criteria for ADHD in partial remission (Faraone et al., 2006). The meta-analysis by Simon et al. (2009) found a global prevalence of ADHD in adulthood of 2.5%. This aligns with more recent findings from Fayyad et al. (2017). After analyzing 26,744 responses from adults across 20 countries using the Composite International Diagnostic Interview (CIDI), they reported a global adult ADHD prevalence of 2.8%. They concluded that “ADHD is prevalent, seriously impairing, and highly comorbid but vastly under-recognised and undertreated across countries and cultures”.
ADHD is linked to functional impairments across various areas; heightened risk of mental health issues (increased anxiety and depression); lower educational attainment; overall poorer functionality; and higher instances of substance abuse, divorce, unemployment, and criminal convictions (Erskine et al., 2016; Kessler et al., 2005; Lichtenstein et al., 2006, as cited in Agnew-Blais et al., 2018). The longitudinal study by Stern et al. (2020) suggests that ADHD symptoms can predict the emergence of emotional problems from childhood through to adulthood.
The lack of physical causes for ADHD has generated controversy in popular media (Tripp and Wickens, 2009), with debates over its diagnosis, pharmacological treatment, and even the disorder’s very existence. Understanding the neurobiological foundation of ADHD is challenging since several behavioural traits are not unique to ADHD alone. For instance, the deficits observed in ADHD in working memory, cognitive flexibility, and attention are similar to those seen in schizophrenia (Banaschewski et al., 2005, as cited in Gallo and Posner, 2016). This issue of specificity persists due to a lack of neuroimaging studies directly comparing individuals with ADHD to those with other disorders (Kasparek et al., 2015).
That being said, Pievsky et al. (2018) conducted a comprehensive literature review on the neurocognitive functioning of individuals with ADHD. After reviewing 34 meta-analyses and weighing the results of each neurocognitive domain by the number of aggregate studies, they observed reduced performance in areas such as working memory, reaction time variability, response inhibition, intelligence/achievement, planning/organisation, and vigilance. The strength of the relationship between diagnosis and neurocognitive functioning was moderated by age, with higher group differences among children and adults than among adolescents.
Several systematic reviews and meta-analyses have sought to shed light on the question: “Are there structural or functional brain differences between individuals with ADHD and those with typical development?”.
Kasparek et al. (2015) reviewed the neuroimaging literature on ADHD. Table 1, adapted from the article, summarises the most important findings in the field of neuroimaging in children.
Table 1. Findings in magnetic resonance imaging studies. Adapted from Kasparek et al. (2015).
| Region | GM | WM | FC |
|---|---|---|---|
| Caudate | ↓ | ↓ | |
| Thalamus | ↓ | ↓ | |
| Anterior cingulated | ↓ | ↓ | ↓ |
| Prefrontal cortex | ↓ | ↓ | ↓ |
| Premotor and SMA cortex | ↓ | ↓ | |
| Superior parietal cortex | ↓ | ↓ | |
| Precuneus, posterior cingulate, lateral parietal cortex, medial frontal cortex (DMN) | ↓ | ||
| Cerebellum (posterior inferior vermis) | ↓ | ↓ | ↓ |
| Corpus callosum (splenium/isthmus) | ↓ | ||
| Fasciculus longitudinalis superior | ↓ | ||
| Anterior corona radiata | ↓ |
Note. The table summarises the most replicated findings in children with ADHD. The arrow indicates a decreased volume of gray or white matter, or a decrease in functional activity and connectivity (ADHD < NT). GM = gray matter; WM = white matter; FC = functional connectivity; SMA = supplementary motor area; DMN = default mode network.
The most recent meta-analysis of structural neuroimaging (Frodl and Skokauskas, 2011) identified reduced volume in individuals with ADHD in the right pallidum, the right putamen, and the bilateral caudate nucleus. It seems these alterations diminish over time and with medication. Nevertheless, adults with ADHD consistently exhibit a reduction in the volume of the anterior cingulate cortex. According to the authors, untreated children might experience more pronounced structural changes in limbic regions, such as the amygdala and the anterior cingulate cortex.
A task-based neuroimaging meta-analysis (Hart et al., 2013) identified differences in inhibiting the inferior frontal cortex, supplementary motor area, anterior cingulate cortex, and regarding attention, the dorsolateral prefrontal and parietal cortices, and cerebellar areas. The meta-analysis of 55 diverse task studies by Cortese et al. (2012) found hypoactivation in the frontoparietal executive control network, the putamen, and the ventral attention network. Substantial hyperactivation was observed in the default mode network (DMN) and the visual circuit.
Regarding meta-analyses of resting-state functional MRI (rsfMRI), the most recent one (Cortese et al., 2021) combined the results of 30 studies using the activation likelihood estimation (ALE) technique. They found no spatial convergence in any area. In contrast, the meta-analysis by Sutcubasi et al. (2020) included 20 seed-based studies and reported decreased DMN activation in children with ADHD.
This meta-analysis seeks to answer the question, “Are there significant differences in whole-brain activation between individuals with ADHD those who are neurotypical (NT)?” With the exception of the Cortese et al. (2021) study, the evidence seems to lean towards “yes”. This meta-analysis offers two primary contributions compared to the most recent one. First, the use of the Seed-based d Mapping (SDM; Radua et al., 2012) methodology is a superior alternative for coordinate-based meta-analyses; it comes with a default setup that balances heightened sensitivity while guarding against false positives. Secondly, this is the first meta-analysis to date focusing on comprehensive whole-brain analysis; using preselected regions of interest (ROI) contradicts the assumption that each voxel, in theory, has an equal likelihood of being reported. This approach introduces significant bias, giving undue weight to these regions (as discussed in Müller et al., 2018 and 2017, referenced in Samea et al., 2019). The meta-analysis by Cortese et al. (2021) includes a majority (18 out of 30) of seed-based studies, thus generating an equally biased activation map.This bias becomes apparent when comparing the results of Cortese et al. (2021) with those from Sutcubasi et al. (2020). The latter pre-selected 4 areas (seeds) for the meta-analysis—also in a resting state—finding disconnectivity in the DMN, with decreased connectivity in the anterior cingulate cortex and increased activity in the inferior frontal gyrus. Thus, this study offers a contribution free of this bias towards the goal of explaining the etiological factors of this complex disorder at the neuronal level.
Method
This meta-analysis was conducted following the recommendations of Müller et al. (2018), the most recent version of Preferred Reporting Items for Systematic Reviews and Meta-Analyses (PRISMA; Page et al., 2020), as well as the standards for quantitative meta-analyses of the American Psychological Association JARS-Quant (APA, 2018).
Information sources
We systematically searched 7 databases: Scopus, PubMed, PsycInfo, Web of Science, ERIC, CINAHL, and Google Scholar. To identify resting-state functional neuroimaging studies comparing individuals with ADHD with NTs, we used the search strings listed in Table 2. Searches included manuscripts published from the start of the databases until February 24, 2021. The search was updated on May 26, 2021. If an article met the inclusion criteria but lacked information, even after consulting the supplementary material, the authors were systematically contacted.
We also reviewed the references of previous meta-analyses and reviews to ensure all eligible studies were included.
Table 2. Search strings and filters used in each database.
| Database | Search query | Additional filters |
|---|---|---|
| Scopus | Title: ADHD OR “attention deficit” OR “hyperactivity disorder” OR hyperactive Title/Abstract/Keywords: fMRI OR “functional connectivity” OR “functional magnetic resonance Imaging” Title/Abstract/Keywords: “resting state” OR rest | Document type: Article Language: English; Spanish |
| PubMed | Title: ADHD OR “attention deficit” OR “hyperactivity disorder” OR hyperactive Title/Abstract: fMRI OR “functional connectivity” OR “functional magnetic resonance Imaging” Title/Abstract: “resting state” OR rest | Species: Humans Language: English; Spanish |
| PsycInfo | Title: ADHD OR “attention deficit” OR “hyperactivity disorder” OR hyperactive All fields: fMRI OR “functional connectivity” OR “functional magnetic resonance Imaging” All fields: “resting state” OR rest | Species: Humans Language: English; Spanish Document type: Dissertation, Journal article |
| Web of Science a | Title: ADHD OR “attention deficit” OR “hyperactivity disorder” OR hyperactive Topic: fMRI OR “functional connectivity” OR “functional magnetic resonance Imaging” Topic: “resting state” OR rest | Language: English; Spanish; Unspecified Document type: Article, Clinical trial, Early access, Case report, Other, Unspecified |
| ERIC | title:(ADHD OR “attention deficit” OR “hyperactivity disorder” OR hyperactive) AND (fMRI OR “functional connectivity” OR “functional magnetic resonance imaging”) AND (“resting state” OR rest) | n/a |
| CINAHL | Title: ADHD OR “attention deficit” OR “hyperactivity disorder” OR hyperactive All fields: fMRI OR “functional connectivity” OR “functional magnetic resonance Imaging” All fields: “resting state” OR rest | Species: Humans Language: English; Spanish Document type: Article, Case study, Clinical trial, PhD thesis, Master’s thesis, Randomised controlled trial, Research |
| Google Scholar b | allintitle: ADHD fMRI rest allintitle: attention deficit rsfMRI allintitle: attention deficit resting state allintitle: ADHD resting state fMRI | Include patents: No Incluir citations: No |
a Databases: WOS, BCI, BIOSIS, CABI, CCC, DIIDW, KJD, MEDLINE, RSCI, SCIELO, ZOOREC
b At present, Google Scholar does not allow the use of Booleans. We used 4 different search strings in order to obtain a search equivalent to the rest of the databases.
Inclusion and exclusion criteria
Inclusion and exclusion criteria were established prior to conducting the search. We included empirical articles—primary studies—that utilized rsfMRI, compared individuals with ADHD—diagnosed according to the DSM-IV, DSM-5, ICD-10, or ICD-11—to neurotypical individuals, and reported their findings as coordinates in a standard stereotactic space with an associated significance value. We exlcuded studies that carried out a priori region of interest (ROI) analyses or functional integration analyses, as well those published in languages other than Spanish or English.
When encountering articles with overlapping samples, we chose to include the one that provided the most comprehensive analysis and results.
Study selection
In the first phase, duplicate articles were automatically discarded by Mendeley and manually by the first reviewer (ÓF-V). In the second phase, the two reviewers (ÓF-V and Silvia Ruiz-Torras) independently screened all articles—with the ‘blind’ option enabled—using Rayyan (Ouzzani et al., 2016) based on their title and abstract. In the third phase, the included references were exported and full texts were obtained. Again, both reviewers assessed the articles independently to determine their inclusion or exclusion. At no point in the screening stages was there a need for a third reviewer to mediate disagreements; any discrepancies were settled through a dialogue between the two reviewers at the end of each stage.
Data compilation
ÓF-V organised the pertinent details from each included article into a standardised table. The metadata collected consisted of: Authors, year, DOI, title, country, journal, objective, and study population. Regarding the study subjects, we gathered: the total sample size; the count of ADHD and NT individuals; the age and either range or standard deviation for each group; details about matching between groups; the percentage of females in each group; ADHD diagnostic criteria (and its instrument); comorbidities (types and percentages); and the percentage of medicated subjects. Methodological details extracted included the scanner’s type and power, pre-scanning instructions given to participants, and the kind of analysis performed. As for the findings, all the coordinates from pertinent analyses were collected, accompanied by their statistical significance values, the paper’s conclusions, and its limitations. Coordinates documented in Talairach were transformed to MNI using Brett tal2mni (Lancaster et al., 2007). Statistical significance values noted as F or p were converted to t via the equation t = √F and the SDM project’s web converter. Lastly, details were gathered on the statistical significance threshold each study employed, noting whether it was adjusted or unadjusted. Following the guidelines by Albajes-Eizagirre et al. (2019), if a t value was provided as the threshold, that value was documented. If a p value was given instead of a t, it was converted to t using the SDM converter. If the paper employed cluster-based statistics, that significance value was used. When none of these values were available, we recorded a threshold value slightly below the significance level of the cluster with the fewest voxels.
Quality assessment
Following previous neuroimaging reviews (Shepherd et al., 2012; Du et al., 2014, as cited in Sun et al., 2020), ÓF-V assessed the quality of the studies using an 11-item checklist (see Table 3). The items are grouped into 3 categories: information about the participants; methods for image acquisition and analysis; and results and conclusions. Each evaluated aspect was scored with a value of 0 if not met, 0.5 if partially met, or 1 if fully met.
Table 3. Quality assessment of methodology by categories.
| Category 1: Subjects |
|---|
| 1. Patients were evaluated prospectively, specific diagnostic criteria were applied, and demographic data were reported. |
| 2. Healthy comparison subjects were evaluated prospectively; psychiatric and medical illnesses were excluded. |
| 3. Important variables (e.g., age, sex, illness duration, onset time, medication status, comorbidity, severity of illness) were checked, either by stratification or statistically. |
| 4. Sample size per group >10. |
| Category 2: Methods for image acquisition and analysis |
| 5. Magnet strength ≥1.5 T. |
| 6. Whole brain analysis was automated with no a priori regional selection. |
| 7. Coordinates reported in a standard space. |
| 8. Processing of the imaging technique was described clearly enough to be reproduced. |
| 9. Measurements were described clearly enough to be reproduced. |
| Category 3: Results and conclusions |
| 10. Statistical parameters were provided for significant and important non-significant differences. |
| 11. Conclusions were consistent with the results obtained, and the limitations were discussed. |
Meta-analysis
We conducted a voxel-based meta-analysis using SDM (Radua et al., 2012), version 6.21. The creators of this software and methodology point out (Albajes-Eizagirre et al., 2019) that most meta-analytic methods rely on a convergence test for “peaks” with various shortcomings. These methods then classify evidence solely based on the p-value. Furthermore, such peak convergence tests operate on the fragile assumption that voxels are independent and equally likely to generate a “false” peak. In reality, within actual gray matter, each voxel is correlated with its neighbors, meaning the likelihood of a voxel showing a “false” peak is influenced by its tissue composition. A perplexing aspect of this approach is that statistical power can increase with fewer genuine effects and decrease with multiple genuine effects. As an alternative, the authors advocate for SDM, which incorporates the brain maps of the reported statistical effects from each study and employs a random effects model to rigorously determine if effects differ from zero. They highlight several advantages: both activations and deactivations are taken into account simultaneously, allowing contradictory findings to negate each other; leveraging effect size with the random effects model enhances reliability and performance.
We input the following variables into SDM for each study, both for hyper and hypoactivation: study name; number of ADHD subjects; number of NT subjects; if comorbidities were controlled; number of elements used to match subjects; average age of the ADHD group; threshold value t; and whether the threshold was corrected or uncorrected.
The preprocessing was done using the default values of SDM. In summary: peaks in gray matter were analysed using 50 imputations to minimise the bias associated with single imputation (Rubin, 1987). On the technical side, we chose the following parameters: Modality as Functional MRI or PET; Correlation template as gray matter; Anisotropy set to 1.00; Isotropic full-width at half-maximum (FWHM) of 20mm; Mask set to gray matter; Voxel size of 2mm. Mean analysis was computed with the default imputation value of 50. To effectively control for false positives, we employed the approach recommended by Radua et al. (2012, as cited in Müller et al., 2018): setting an uncorrected p-value threshold at .005 and a cluster size of 10 voxels.
If there were enough studies, factors such as age, the number of variables used for matching, and comorbidities would be employed for a sub-analysis to assess heterogeneity.
Publication bias
Study heterogeneity was analysed using the τ, Q, and P values provided by SDM preprocessing. Likewise, publication bias was assessed through visual inspection of the funnel plot produced via SDM using coordinates of significant areas.
Results
Study selection
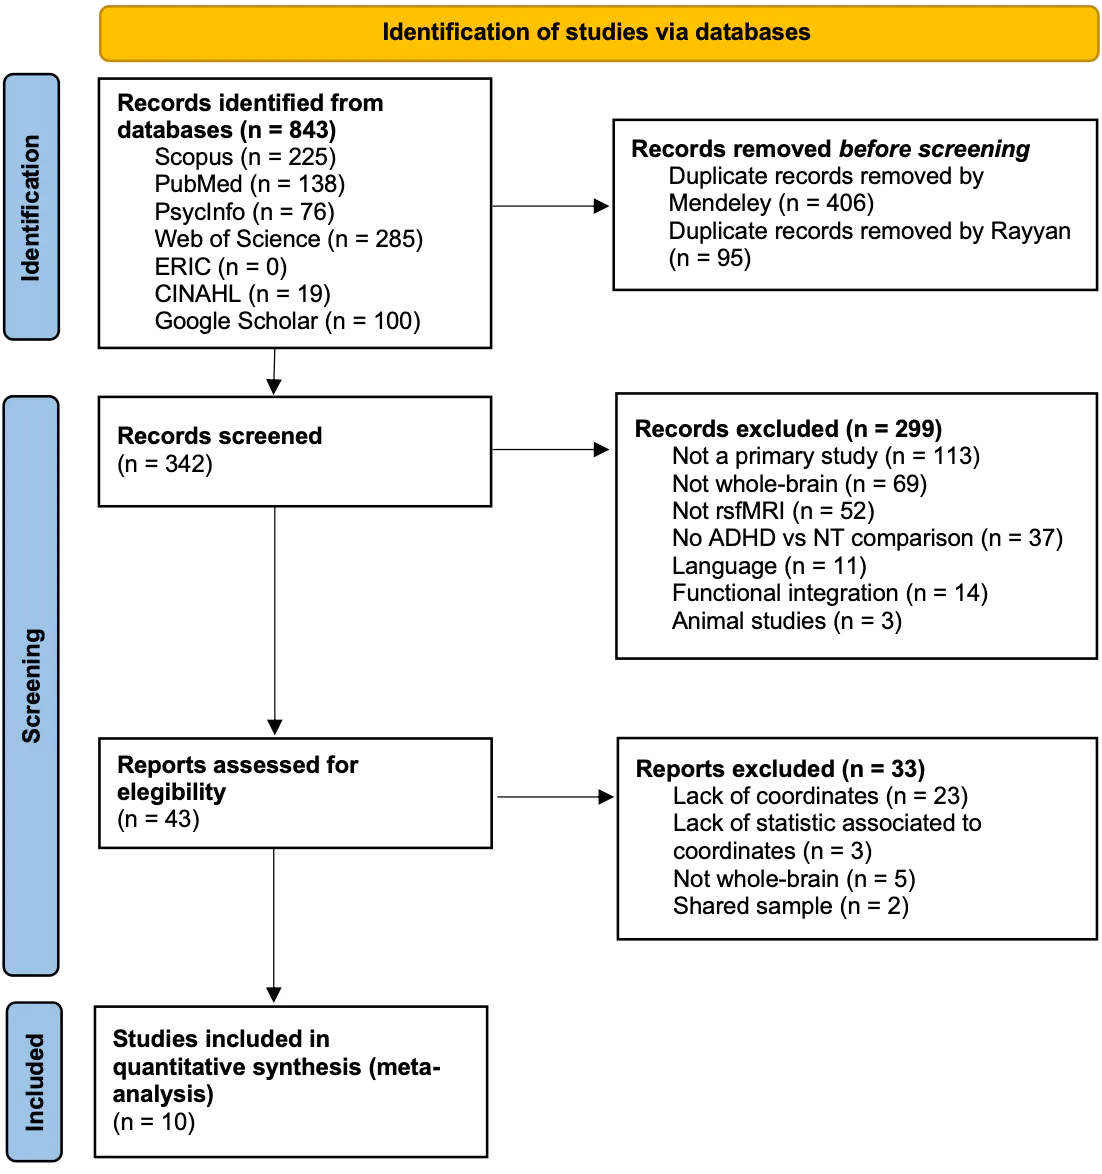
The initial search yielded 843 records (see Figure 1). After removing duplicates, 342 articles were independently screened with an initial agreement rate among reviewers of 86.29%. Most excluded articles due to the use of seeds or ROI focused on the default mode network, the cognitive control network, subcortical regions, striatum, nucleus accumbens, caudate nucleus, or the putamen. After reviewing the full texts with an initial agreement rate of 95.34%, 33 articles were excluded. Three of them shared samples: An et al. (2013), Tian et al. (2008), and Cao et al. (2006). The most recent paper was chosen for providing a more comprehensive data analysis. Three articles did not provide statistical information related to the peak coordinates: de Celis Alonso et al. (2014), Qiu et al. (2010), and Somandepalli et al. (2015). We reached out to these authors, but they were eventually excluded either due to a lack of response or because the data wasn’t available. Hence, we were left with 10 articles for the meta-analysis (marked with an asterisk in References).
Figure 1. PRISMA flowchart for the search and selection/exclusion of studies.
Characteristics of the included studies
Table 4 displays the features of the 10 selected studies. 80% of the studies originate from China; one is from Iran (Shekarchi et al., 2014) and another (Shang et al., 2018) from Taiwan. Surprisingly, none of the selected articles studied the adult population; the weighted average age for the studies is 11.03 in the ADHD group and 10.69 in the NT group. Most studies did not include girls in their sample. In those that did (3/10), girls made up between 8.1% and 54% of the sample. The average sample size is 68.2, ranging from 25 to 182. Most studies (8 out of 10) matched subjects from each group using at least one variable. Almost all the studies controlled for comorbidities; only 3 included participants with oppositional defiant disorder, learning disabilities, Tourette syndrome, or conduct disorder. Regarding medication, half of the articles only included children with no medication history; the rest either reported that the number of medicated ADHD subjects was non-zero (n=2) or reported the number of subjects currently on medication (n=2). One article did not provide this information.
All studies used Siemens scanners with a power of at least 1.5 T. Except for one study (An et al., 2013b), all articles provided information on the instructions given to subjects before undergoing neuroimaging. All asked subjects to close their eyes, but there was variability in other instructions: some studies asked subjects not to think about anything systematically, others not to focus on any particular thoughts, while others wanted them to remain calm. There’s variation in the type of analysis performed: most (60%) used Regional Homogeneity (ReHo); half employed Amplitude of Low-Frequency Fluctuations (ALFF); two studies used Degree Centrality (DC) analysis; one conducted an analysis of homotopic connectivity reflected in voxels (VMHC); and one used group Independent Component Analysis (ICA). Eight studies reported peaks using MNI stereotactic space coordinates, and two used the Talairach standard. Out of the 10 studies, 7 reported statistical peak values with the t value; the other 3 used the p-value (2) or the F value (1).
Table 4. Descriptive data of the studies included in the meta-analysis.
| Reference | n (ADHD) | Age (ADHD) | Percentage medicated (ADHD) | n (NT) | Age (NT) | Matching | Type of analysis | Significance threshold (t) |
|---|---|---|---|---|---|---|---|---|
| An et al. (2013a) | 19 | 13.3 | 0% | 23 | 13.2 | Age. | ReHo; ALFF | 2.42 |
| An et al. (2013b) | 22 | 12.5 | 32% | 30 | 11.8 | Age and dominant hand. | ReHo | 2.40 |
| Jiang et al. (2019) | 30 | 9.2 | 0% | 33 | 9.7 | Age, gender and dominant hand. | DC; VMHC | 2.34 |
| Jiang et al. (2020) | 18 | 8.8 | n/a | 18 | 9 | Unmatched. | ALFF | 2.44 |
| Li et al. (2014) | 33 | 10.1 | 0% | 32 | 10.9 | Dominant hand. | ALFF | 1.67 a |
| Shang et al. (2018) | 37 | 10.5 | 0% | 37 | 11.1 | n/a | ReHo | 2.65 |
| Wang et al. (2017) | 91 | 12.4 | >0% | 91 | 12.2 | Age and dominant hand. | ALFF; ReHo; DC | 2.12 |
| Shekarchi et al. (2014) | 21 | 8.5 | >0% | 21 | n/a | Age. | ReHo; Group ICA | 1.65 a |
| Yu et al. (2016) | 30 | 10.2 | 0% | 30 | 10.3 | Age and dominant hand. | ReHo | 2.66 |
| Zang et al. (2007) | 13 | 13 | 15% | 12 | 13.1 | Age and dominant hand. | ALFF | 2.796 |
Note. Additional data were collected: DOI, country, study objective, population, diagnosis, comorbidities, age range or standard deviation, participant instructions during the MRI, types of analyses, conclusions, and limitations. This information is available in the respective original articles.
a Corrected value. All other values are uncorrected.
Study results
Half of the articles (An et al., 2013a and 2013b; Jiang et al. 2019 and 2020; Wang et al. 2017; Shekarchi et al., 2014; Yu et al., 2016; and Zeng et al., 2007) reported dysfunction in the cerebellum. 30% found differences in activation in the anterior cingulate cortex (An et al., 2013a; Shekarchi et al., 2014; Zeng et al., 2007). Table 5 contains the specific coordinates pinpointed by each study, along with findings pertinent to this meta-analysis. Table 6 outlines the limitations reported by each study.
Table 5. Coordinates along with their t-statistic and the findings of each article.
| Study | MNI Coordinates (x, y, z, t) | Findings |
|---|---|---|
| An et al. (2013a) | 18, -84, -33, -4.67 48, 45, 12, -4.64 More-33, -60, -30, -4.3130, -75, -24, -4.19 6, -48, 75, -3.69 3, 51, 12, -3.46 -3, 54, 3, -3.20 18, -78, -3, 3.69 15, 42, 21, 3.08 -24, -60, -6, 3.4 18, -81, -3, 4.52 69, -21, 24, -4.05 30, -72, -27, -3.89 -42, 30, -18, -3.86 42, 0, 63, -3.75 -3, 0, 60, -3.49 12, 6, 66, -3.12 18, 6, -15, -3.37 -6, -78, -21, -3.32 66, 0, 9, -3.24 33, 21, 54, -3.18 0, -51, 21, -2.91 21, -78, -3, 4.08 -39, 39, -3, 3.63 -21, -93, -12, 3.27 -21, -30, 72, 3.53 -9, -75, 21, 3.38 -27, 39, 21, 3.20 -60, 0, -24, -3.8 | ADHD symptoms correlated with ReHo values in the right cerebellum, anterior cingulate cortex, and left lingual gyrus, but not with ALFF values. |
| An et al. (2013b) | -18, 54, 15, -4.00 18, 24, 45, -3.53 More-12, -81, 24, 5.07-3, -18, 57, 4.26 15, -102, 6, 3.16 21, -39, 66, 3.93 18, -9, 66, 3.78 18, -63, 18, 3.60 -45, -30, 66, 3.59 | A dose of methylphenidate normalised fronto-parieto-cerebellar dysfunctions in boys with ADHD at rest. |
| Jiang et al. (2019) | -9, -30, 63, 5.81 9, -30, 63, 5.81 More-6, -84, 27, 5.826, -84, 27, 5.82 -6, -60, -45, 6.17 6, -60, -45, 6.17 | Compared to the NT group, children with ADHD showed higher VMHC activation in the bilateral superior frontal lobe and bilateral anterior cerebellar lobes. |
| Jiang et al. (2020) | 3, 39, -21, 4.14 -30, -6, -36, 2.59 More-54, -57, -6, -5.733, -54, -12, 3.63 -48, -36, 51, -1.62 | The ADHD group showed increased ALFF in the bilateral medial prefrontal cortex, inferior temporal gyrus, and anterior cerebellar lobe, and decreased ALFF in the left central temporal gyrus. |
| Li et al. (2014) | 18.18, 6, 2, 2.98 -12.12, 6, 2, 2.73 More21.21, 30, 38, 1.99-24, 47, -11, -2.73 -18, 71, 5, -2.84 | The ADHD group exhibited impairment in executive functions; decreased ALFF in the left orbitofrontal cortex and upper ventral left frontal gyrus; and increased ALFF in the right pallidum and the right dorsal superior frontal gyrus. |
| Shang et al. (2018) | 33, -9, -6, -8 -33, -9, -6, -6.05 More0, -66, 15, -3.7248, -12, 45, -6.28 -9, 9, 42, -4.83 -3, -36, 54, -5 | The CT haplotype significantly interacted with ADHD in the right postcentral gyrus. |
| Wang et al. (2017) | 0, -75, 24, 3.59 33, -69, -36, -3.70 More-3, -33, 69, 4.15-6, 51, -6, 3.34 | Grouped data showed abnormal activity in ADHD in various regions: bilateral somatosensory cortex, bilateral cerebellum, and bilateral lingual gyrus. |
| Shekarchi et al. (2014) | 34, 45, 16, -2.15 22, 43, 12, -2.42 More25, 9, 28, -2.4215, 47, 26, -2.12 22, 18, 4, -1.68 29, 8, 13, -2.42 15, 33, 8, -2.46 | Hypoactivation in ADHD was observed in the anterior cingulate cortex, inferior frontal gyrus, posterior components of the default mode network, cerebellum, and brainstem. |
| Yu et al. (2016) | -3, 63, 39, -4.39 51, -51, 33, -3.84 More-6, -48, 39, -3.7024, -48, -57, 3 | Compared to the NT group, the ADHD group showed lower ReHo in the default mode network. The ADHD group showed higher ReHo in the posterior cerebellum. |
| Zang et al. (2007) | -50, -59, -25, 3.69 13, -26, -5, -4.00 More46, 19, 7, -3.8262, -53, -17, 4.60 -10, -29, 72, 3.19 -4, -68, -18, -3.39 -13, -58, -39, -3.36 28, -65, -29, -3.78 46, -54, -57, -3.82 7, 11, 42, 3.83 -7, -19, -16, -4.05 | Decreased ALFF in ADHD was observed in the right inferior frontal cortex and cerebellum. Increased ALFF was found in the anterior cingulate cortex, somatosensory cortex, and bilateral brainstem. |
Table 6. Limitations described in each study.
| Study | Limitations |
|---|---|
| An et al. (2013a) | n/a |
| An et al. (2013b) | Small sample in sub-analysis; uncontrolled medication history; inherent biases due to ReHo smoothing. |
| Jiang et al. (2019) | Limited sample size. |
| Jiang et al. (2020) | Age of NT group had a smaller range than the other groups. |
| Li et al. (2014) | Possible distortion of differences in functional connectivity by use of regression on global signal; mixing of subtypes in ADHD group. |
| Shang et al. (2018) | Modest sample size; wide age range in ADHD group. |
| Wang et al. (2017) | Small sample size did not allow exploring the contribution of ADHD subtype; only 3 measures were used to assess consistency between cohorts. |
| Shekarchi et al. (2014) | n/a |
| Yu et al. (2016) | ADHD group with IQ scores below NT and not controlled for in ANOVA; heterogeneity of subtypes; 13 children with comorbidities; only includes boys, not girls. |
| Zeng et al. (2007) | They could not correct the bias generated by the heart rate; they did not use correction for multiple comparisons when comparing groups; they did not present the correlation between IQ and ALFF; the mix of ADHD subtypes may have affected the results. |
Synthesis of results
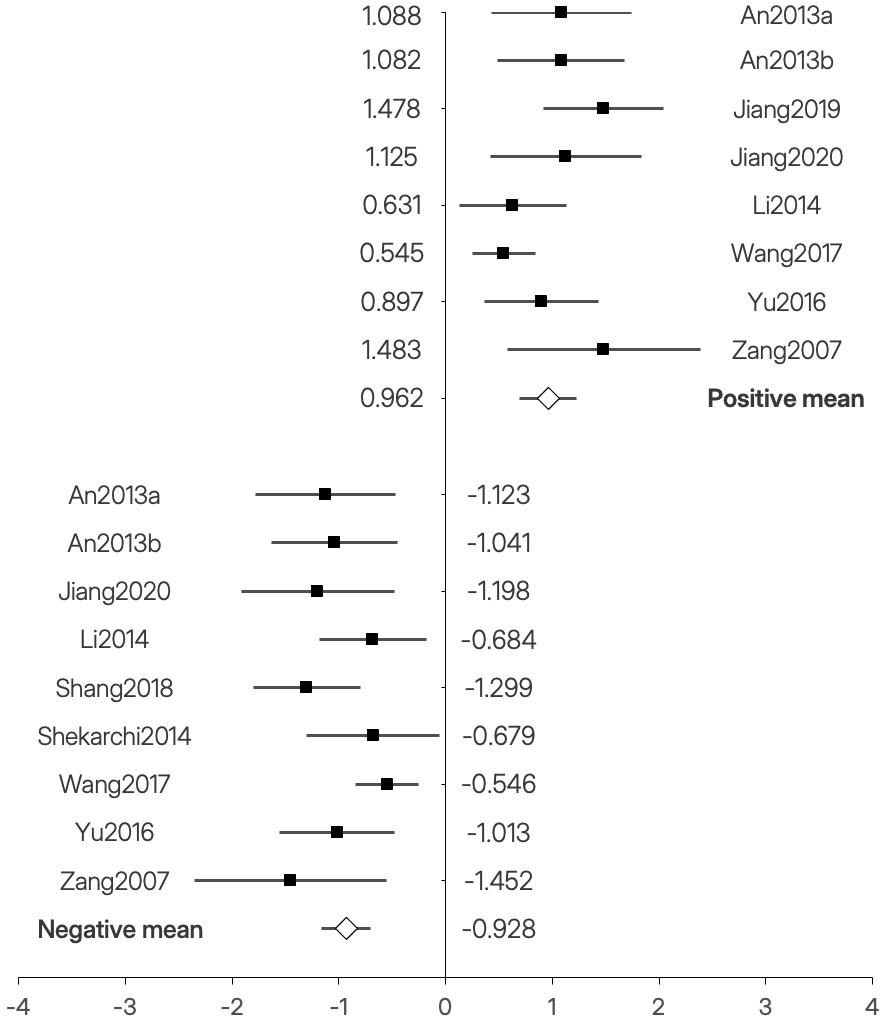
All the studies reported at least four significant peaks when comparing the ADHD group to the NT group (see Table 5). The effect sizes (absolute value of Cohen’s d) ranged from 0.545 (Wang et al., 2017) to 1.483 (Zang et al., 2007). Following the recommendations of Sawilowsky (2009), all would be classified between a medium and very large effect size. Figure 2 displays the forest plot with the effect sizes, confidence intervals, and the average for each peak group (positive and negative).
Figure 2. Forest plot of the meta-analysed articles. The horizontal axis represents Cohen’s d effect size.
The heterogeneity values of the positive peaks were moderate (I2 = 46.99; Q = 13.20; df = 7), while those of the negative peaks were low (I2 = 32.45; Q = 11.84; df = 8). Due to the limited number of studies found, we couldn’t conduct sub-analyses with enough power to explore the effects of variables such as age, gender, or comorbidities.
The meta-analysis was conducted in SDM. Using an uncorrected p-threshold < .05, three statistically significant peaks emerged, listed in Table 7. We found 2 clusters with positive differences (ADHD > NT) larger than 25 voxels in the left paracentral lobe and the corpus callosum. The most significant cluster (p < .001; 543 voxels; SDM-Z = -3.683) was a negative difference (ADHD < NT) in the right cerebellum. Coordinates can be seen in Table 7 and Figures 3 and 4. The complete significant areas are represented in Figure 5. Upon a more stringent post hoc analysis, evaluating the data after applying the Family-Wise Error Correction (FWEC) via SDM with 1,000 permutations, only the peak in the right cerebellum surpassed the p < .05 threshold.
Table 7. Significant clusters with |SDM-Z| ≥ 1.96.
| MNI Coordinates | SDM-Z a | p | Voxels | Area b |
|---|---|---|---|---|
| -6, -30, 74 | 3.112 | 0.000928640 | 75 | Left paracentral lobe, BA 4 |
| -8, -76, 26 | 2.886 | 0.001951694 | 25 | Corpus callosum |
| 34, -64, -32 | -3.683 | 0.000115097 | 543 | Right cerebellum, crus I b |
Note. BA = Brodmann Area.
a The SDM-Z value is the effect size (Hedges’ g) divided by the standard error. Being based on SDM permutation values, it does not follow a normal distribution.
b The finding in the right cerebellum is the only one that survived with p=.0469 after applying FWEC. The cluster size was reduced to 5 voxels with the correction.
Figure 3. Representation of the significant negative peak in the right cerebellum.
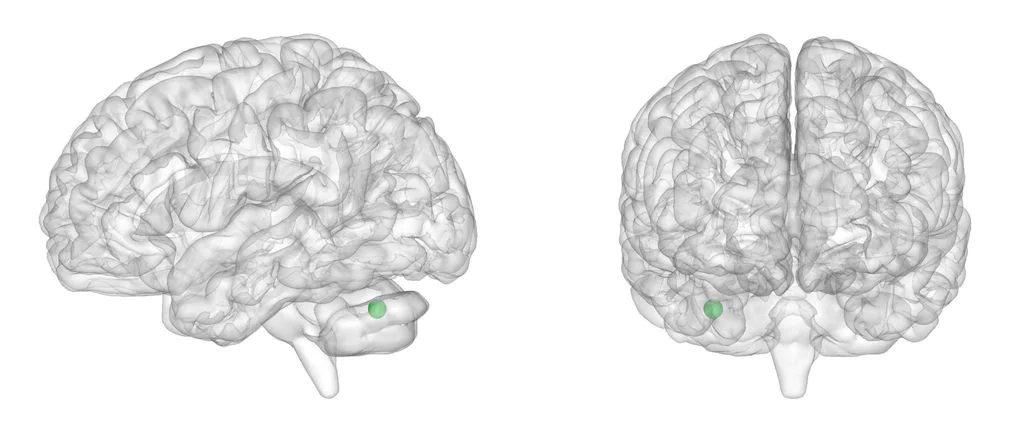
Figure 4. Lateral, medial, and dorsal views of the two significant positive peaks based on their size.
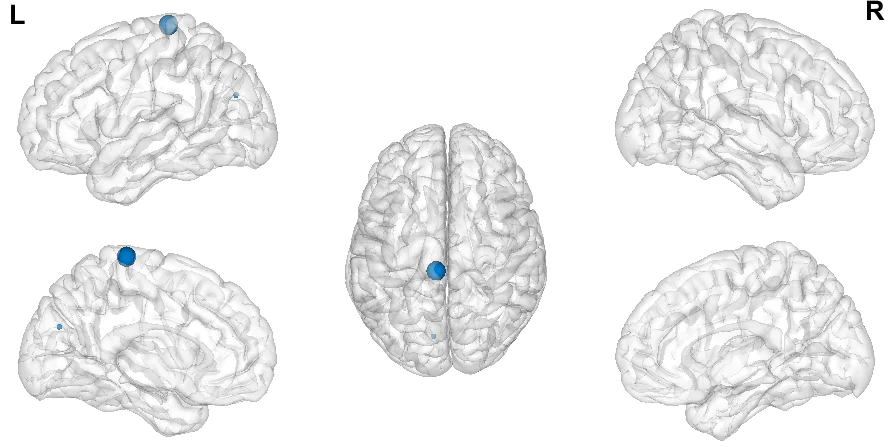
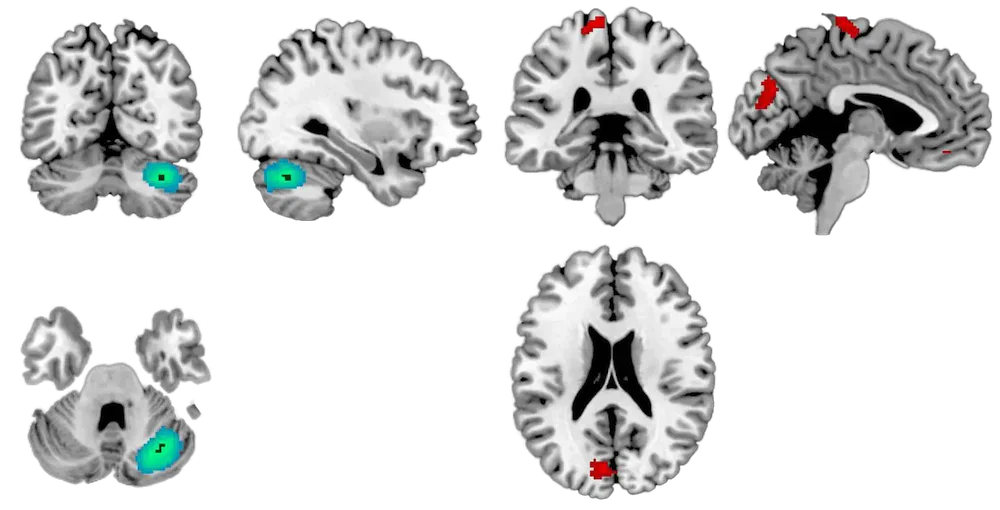
Figure 5. Coronal, sagittal, and axial cuts of the hypoactivated area (left) and hyperactivated areas (right).
A visual inspection of the funnel plot (Figure 6) associated with the statistically significant cerebellar coordinate does not suggest evidence of publication bias.
Figure 6. Funnel plot for the statistically significant cluster of reduced activation in the cerebellum.

Quality assessment
Table 8 shows the quality assessment of the articles included in the meta-analysis. Most of them obtained the highest score in the different categories.
Table 8. Assessment of the quality of each item by category.
| Study | S 1 | S 2 | S 3 | S 4 | M 5 | M 6 | M 7 | M 8 | M 9 | R 10 | R 11 | Score out of 11 |
|---|---|---|---|---|---|---|---|---|---|---|---|---|
| An2013a | 1 | 1 | 1 | 1 | 1 | 1 | 1 | 1 | 1 | 1 | 0.5 | 10.5 |
| An2013b | 1 | 1 | 1 | 1 | 1 | 1 | 1 | 1 | 1 | 1 | 1 | 11 |
| Jiang2019 | 1 | 1 | 1 | 1 | 1 | 1 | 1 | 1 | 1 | 1 | 1 | 11 |
| Jiang2020 | 1 | 0 | 1 | 1 | 1 | 1 | 1 | 1 | 0.5 | 1 | 1 | 9.5 |
| Li2014 | 1 | 1 | 1 | 1 | 1 | 1 | 1 | 1 | 1 | 1 | 1 | 11 |
| Shang2018 | 1 | 1 | 1 | 1 | 1 | 1 | 1 | 1 | 1 | 1 | 1 | 11 |
| Wang2017 | 1 | 0.5 | 1 | 1 | 1 | 1 | 1 | 1 | 1 | 1 | 1 | 10.5 |
| Shekarchi2014 | 1 | 1 | 1 | 1 | 1 | 1 | 1 | 0.5 | 1 | 0.5 | 0.5 | 9.5 |
| Yu2016 | 1 | 1 | 1 | 1 | 1 | 1 | 1 | 1 | 1 | 1 | 1 | 11 |
| Zang2007 | 1 | 0.5 | 1 | 1 | 1 | 1 | 1 | 1 | 1 | 1 | 0.5 | 10 |
Note. Column prefixes: “S” for “Subjects”, “M” for “Methods for image acquisition and analysis”, and “R” for “Results and conclusions” (details in Table 3). One point per criterion fully satisfied, 0.5 for partially satisfied, 0 for otherwise.
Discussion
We conducted a meta-analysis following the best available practices (Müller et al., 2018). After applying rigorous selection criteria, we included 10 papers focused on resting brain activations in children with ADHD compared to NT peers. The meta-analysis found spatial convergence in three regions: two smaller positive clusters in the left paracentral lobule and the corpus callosum, and a larger negative cluster in the right cerebellum. Only the latter finding persisted when undergoing a post-hoc analysis with FWEC, setting a threshold at p < .05.
These results contrast with the most recent findings (Cortese et al., 2021). This is not unexpected. Firstly, these authors included 18 seed-based studies. After meta-analysing these articles, they incorporated whole-brain studies. This means that only about 40% of their articles met the criteria applied in this meta-analysis. Secondly, the meta-analyses also differ due to the peak analysis methodology: Cortese et al. (2021) used ALE instead of SDM. Hence, our meta-analysis can be viewed as a more specific synthesis in the field of rsfMRI in ADHD.
The findings related to the hypoactivation peak in the cerebellum are not surprising—it’s one of the earlier reported. Moreover, methylphenidate, one of the most common and effective pharmacological treatments for ADHD, induces changes in cerebellar activation in children (Rubia et al., 2009, as cited in Stoodley, 2016). Additionally, the fronto-cerebellar network is associated with the ability to estimate activity timings, time intervals, and temporal predictions (Durston, van Belle, and de Zeeuw, 2011, as cited in Kasparek et al., 2015)—tasks particularly challenging for those with ADHD.
On the other hand, the positive peak in the left paracentral lobule is located in the primary motor cortex area. Its function—managing motor movements involving contralateral movements of fingers, hands, wrists, or orofacial areas; executing learned motor sequences; controlling respiration; and voluntary blinking—aligns with the characteristics of the disorder, particularly the hyperactivity subtype. Furthermore, the corpus callosum plays a crucial role in interhemispheric communication; dysfunction in this area might contribute to brain network alterations associated with ADHD (Gehrickle et al., 2017).
The quality of the evidence found is moderately high, with well-documented protocols, potential improvements in sample sizes, and some statistical significance thresholds that might be considered overly lenient.
The generalizability of the conclusions is limited for various reasons. Firstly, none of the studies examined the young or adult population. Moreover, the proportion of girls in the samples is rather small. Although there is higher prevalence in boys than in girls, the variations in the manifestation of the disorder (Ramtekkar et al., 2010) warrant investigation.
The interpretation of this meta-analysis should be made with its strengths and weaknesses in mind. In terms of strengths, we conducted an exhaustive search across databases; adhered to the guidelines for neuroimaging meta-analysis and PRISMA standards; utilised Rayyan to lessen the chance of missing evidence; and ensured that screening at all stages was independently undertaken by two reviewers. We carefully selected articles before including them, excluding studies with shared samples or those that were not whole-brain analysis, and we assessed the quality of the selected papers. Finally, we identified significant findings despite the limited number of studies, with a funnel plot that does not suggest publication bias for the peak associated with the cerebellum.
Beyond the limitations acknowledged by each study (Table 6), this meta-analysis has various limitations of its own. Most evidently, the small number of studies analysed (n = 10) means the meta-analysis has relatively low statistical power, making it difficult to detect smaller effects and increasing the risk of results being influenced by individual studies. This small sample size prevented sub-analyses to examine heterogeneity across factors like sex, age, diagnosis type, or medication. It’s also worth noting that, unlike other meta-analyses, we only included research published in English or Spanish, omitting studies published in Chinese, for example. Another limitation is the exclusion of ROI analysis experiments, potentially introducing bias by discarding many studies (Müller et al., 2018). To avoid neglecting the importance of the brain regions typically used as ROIs, the number of studies excluded for this reason has been reported, along with the most common regions examined. Finally, rsfMRI studies cannot determine the functional role of brain areas, known only by analogy with other research (Wig et al., 2011, as cited in Tomasi and Volkow, 2011). With this in mind, and considering the results of any rsfMRI study must be interpreted cautiously, the same prudence is warranted when considering the functional implications of meta-analyses that aggregate this evidence.
In summary, we identified significant rsfMRI alterations in the cerebellum, a region involved in neuropsychological processes impaired in ADHD. This meta-analysis adds to the growing field of neuroimaging in psychological disorders. Future studies should strive for samples with robust statistical power and include both females and adults to explore the pathology’s heterogeneity and better understand the disorder’s progression over time.
References
Agnew-Blais, J. C., Polanczyk, G. V., Danese, A., Wertz, J., Moffitt, T. E., y Arseneault, L. (2018). Young adult mental health and functional outcomes among individuals with remitted, persistent and late-onset ADHD. British Journal of Psychiatry, 213(3), 526-534. https://doi.org/10.1192/bjp.2018.97
Albajes-Eizagirre, A., Solanes, A., Fullana, M. A., Ioannidis, J. P. A., Fusar-Poli, P., Torrent, C., Solé, B., Bonnín, C. M., Vieta, E., Mataix-Cols, D., y Radua, J. (2019). Meta-analysis of Voxel-Based Neuroimaging Studies using Seed-based d Mapping with Permutation of Subject Images (SDM-PSI). Journal of Visualized Experiments : JoVE, 153. https://doi.org/10.3791/59841
American Psychiatric Association. (2013). Diagnostic and statistical manual of mental disorders (5th ed.). American Psychiatric Pub. https://doi.org/10.1176/appi.books.9780890425596
American Psychological Association. (2018). Quantitative Research Design (JARS–Quant). https://apastyle.apa.org/jars/quantitative
* An, L., Cao, Q.-J., Sui, M.-Q., Sun, L., Zou, Q.-H., Zang, Y.-F., y Wang, Y.-F. (2013). Local synchronization and amplitude of the fluctuation of spontaneous brain activity in attention-deficit/hyperactivity disorder: A resting-state fMRI study. Neuroscience Bulletin, 29(5), 603-613. https://doi.org/10.1007/s12264-013-1353-8
* An, L., Cao, X.-H., Cao, Q.-J., Sun, L., Yang, L., Zou, Q.-H., Katya, R., Zang, Y.-F., y Wang, Y.-F. (2013). Methylphenidate normalizes resting-state brain dysfunction in boys with attention deficit hyperactivity disorder. Neuropsychopharmacology : Official Publication of the American College of Neuropsychopharmacology, 38(7), 1287-1295. https://doi.org/10.1038/npp.2013.27
Arnsten, A. F. T. (2009). The Emerging Neurobiology of Attention Deficit Hyperactivity Disorder: The Key Role of the Prefrontal Association Cortex. The Journal of Pediatrics, 154(5), I-S43. https://doi.org/10.1016/j.jpeds.2009.01.018
Canals, J., Morales-Hidalgo, P., Jané, M. C., y Domènech, E. (2018). ADHD Prevalence in Spanish Preschoolers: Comorbidity, Socio-Demographic Factors, and Functional Consequences. Journal of Attention Disorders, 22(2), 143-153. https://doi.org/10.1177/1087054716638511
Cao, Q., Zang, Y.-F., Sun, L., y Long, X. (s. f.). Abnormal neural activity in children with attention deficit hyperactivity disorder: A resting-state functional magnetic resonance imaging study C3-Brain (2013-2030). https://doi.org/10.1097/01.wnr.0000224769.92454.5d
Cheung, C. H. M., Rijdijk, F., McLoughlin, G., Faraone, S. V., Asherson, P., y Kuntsi, J. (2015). Childhood predictors of adolescent and young adult outcome in ADHD. Journal of Psychiatric Research, 62, 92-100. https://doi.org/10.1016/j.jpsychires.2015.01.011
Cortese, S., Aoki, Y. Y., Itahashi, T., Castellanos, F. X., y Eickhoff, S. B. (2021). Systematic Review and Meta-analysis: Resting-State Functional Magnetic Resonance Imaging Studies of Attention-Deficit/Hyperactivity Disorder. Journal of the American Academy of Child and Adolescent Psychiatry, 60(1), 61-75. https://doi.org/10.1016/j.jaac.2020.08.014
Cortese, S., Kelly, C., Chabernaud, C., Proal, E., Di Martino, A., Milham, M. P., y Xavier Castellanos, F. (2012). Toward Systems Neuroscience of ADHD: A Meta-Analysis of 55 fMRI Studies. American Journal of Psychiatry, 169(10), 1038-1055. https://doi.org/10.1176/appi.ajp.2012.11101521
De Celis Alonso, B., Hidalgo Tobón, S., Dies Suarez, P., García Flores, J., De Celis Carrillo, B., y Barragán Pérez, E. (2014). A multi-methodological MR resting state network analysis to assess the changes in brain physiology of children with ADHD. PLoS ONE, 9(6). https://doi.org/10.1371/journal.pone.0099119
Faraone, S. V., Biederman, J., y Mick, E. (2006). The age-dependent decline of attention deficit hyperactivity disorder: A meta-analysis of follow-up studies. Psychological Medicine, 36(2), 159-165. https://doi.org/10.1017/S003329170500471X
Fayyad, J., Sampson, N. A., Hwang, I., Adamowski, T., Aguilar-Girolamo, G., Florescu, S., Gureje, O., Haro, J. M., Hu, C., Karam, E. G., Lee, S., Navarro-Mateu, F., O’Neill, S., Pennell, B. E., Piazza, M., Posada-Villa, J., Have, ten M., Torres, Y., Xavier, M., … Kessler, R. C. (2017). The descriptive epidemiology of DSM-IV Adult ADHD in the World Health Organization World Mental Health Surveys. Atten Defic Hyperact Disord, 9(1), 47-65. https://doi.org/10.1007/s12402-016-0208-3
Franke, B., Michelini, G., Asherson, P., Banaschewski, T., Bilbow, A., Buitelaar, J. K., Cormand, B., Faraone, S. V., Ginsberg, Y., Haavik, J., Kuntsi, J., Larsson, H., Lesch, K. P., Ramos-Quiroga, J. A., Réthelyi, J. M., Ribases, M., y Reif, A. (2018). Live fast, die young? A review on the developmental trajectories of ADHD across the lifespan. European Neuropsychopharmacology, 28(10), 1059-1088. https://doi.org/10.1016/j.euroneuro.2018.08.001
Frodl, T. y Skokauskas, N. (2012). Meta-analysis of structural MRI studies in children and adults with attention deficit hyperactivity disorder indicates treatment effects. Acta Psychiatrica Scandinavica, 125(2), 114-126. https://doi.org/10.1111/j.1600-0447.2011.01786.x
Gallo, E. F., & Posner, J. (2016). Moving towards causality in attention-deficit hyperactivity disorder: Overview of neural and genetic mechanisms. The Lancet Psychiatry, 3(6), 555–567. https://doi.org/10.1016/S2215-0366(16)00096-1
Gehricke, J. G., Kruggel, F., Thampipop, T., Alejo, S. D., Tatos, E., Fallon, J., y Muftuler, L. T. (2017). The brain anatomy of attention-deficit/hyperactivity disorder in young adults - A magnetic resonance imaging study. PLoS ONE, 12(4), 1-21. https://doi.org/10.1371/journal.pone.0175433
Hart, H., Radua, J., Nakao, T., Mataix-Cols, D., y Rubia, K. (2013). Meta-analysis of functional magnetic resonance imaging studies of inhibition and attention in attention-deficit/hyperactivity disorder: Exploring task-specific, stimulant medication, and age effects. JAMA Psychiatry, 70(2), 185-198. https://doi.org/10.1001/jamapsychiatry.2013.277
* Jiang, K., Wang, J., Zheng, A., Li, L., Yi, Y., Ding, L., Li, H., Dong, X., y Zang, Y. (2020). Amplitude of low-frequency fluctuation of resting-state fMRI in primary nocturnal enuresis and attention deficit hyperactivity disorder. International Journal of Developmental Neuroscience, 80(3), 235-245. https://doi.org/10.1002/jdn.10020
* Jiang, K., Yi, Y., Li, L., Li, H., Shen, H., Zhao, F., Xu, Y., y Zheng, A. (2019). Functional network connectivity changes in children with attention-deficit hyperactivity disorder: A resting-state fMRI study. International Journal of Developmental Neuroscience, 78(July), 1-6. https://doi.org/10.1016/j.ijdevneu.2019.07.003
Kasparek, T., Theiner, P., y Filova, A. (2015). Neurobiology of ADHD From Childhood to Adulthood: Findings of Imaging Methods. Journal of Attention Disorders, 19(11), 931-943. https://doi.org/10.1177/1087054713505322
Lancaster, J. L., Tordesillas-Gutiérrez, D., Martinez, M., Salinas, F., Evans, A., Zilles, K., Mazziotta, J. C., y Fox, P. T. (2007). Bias between MNI and talairach coordinates analyzed using the ICBM-152 brain template. Human Brain Mapping, 28(11), 1194-1205. https://doi.org/10.1002/hbm.20345
* Li, F., He, N., Li, Y., Chen, L., Huang, X., Lui, S., Guo, L., Kemp, G. J., y Gong, Q. (2014). Intrinsic Brain Abnormalities in Attention Deficit Hyperactivity. Radiology, 272(2), 514-523. https://doi.org/10.1148/radiol.14131622
Menon, V. (2011). Large-scale brain networks and psychopathology: a unifying triple network model. Trends in Cognitive Sciences, 15(10), 483-506. https://doi.org/10.1016/j.tics.2011.08.003
Müller, V. I., Cieslik, E. C., Laird, A. R., Fox, P. T., Radua, J., Mataix-Cols, D., Tench, C. R., Yarkoni, T., Nichols, T. E., Turkeltaub, P. E., Wager, T. D., y Eickhoff, S. B. (2018). Ten simple rules for neuroimaging meta-analysis. Neuroscience and Biobehavioral Reviews, 84, 151-161. https://doi.org/10.1016/j.neubiorev.2017.11.012
Ouzzani, M., Hammady, H., Fedorowicz, Z., y Elmagarmid, A. (2016). Rayyan-a web and mobile app for systematic reviews. Systematic Reviews, 5(1). https://doi.org/10.1186/s13643-016-0384-4
Page, M. J., McKenzie, J. E., Bossuyt, P. M., Boutron, I., Hoffmann, T. C., Mulrow, C. D., Shamseer, L., Tetzlaff, J. M., Akl, E. A., Brennan, S. E., Chou, R., Glanville, J., Grimshaw, J. M., Hróbjartsson, A., Lalu, M. M., Li, T., Loder, E. W., Mayo-Wilson, E., McDonald, S., … Moher, D. (2021). The PRISMA 2020 statement: an updated guideline for reporting systematic reviews. BMJ, 372. https://doi.org/10.1136/bmj.n71
Pievsky, M. A., y McGrath, R. E. (2018). The Neurocognitive Profile of Attention-Deficit/Hyperactivity Disorder: A Review of Meta-Analyses. Archives of Clinical Neuropsychology : The Official Journal of the National Academy of Neuropsychologists, 33(2), 143-157. https://doi.org/10.1093/arclin/acx055
Polanczyk, G. V, Willcutt, E. G., Salum, G. A., Kieling, C., y Rohde, L. A. (2014). ADHD prevalence estimates across three decades: an updated systematic review and meta-regression analysis. International Journal of Epidemiology, 43(2), 434-442. https://doi.org/10.1093/ije/dyt261
Polanczyk, G., y Jensen, P. (2008). Epidemiologic Considerations in Attention Deficit Hyperactivity Disorder: A Review and Update. Child and Adolescent Psychiatric Clinics of North America, 17(2), 245-260. https://doi.org/10.1016/j.chc.2007.11.006
Posner, J., Polanczyk, G. V, y Sonuga-Barke, E. (2020). Attention-deficit hyperactivity disorder. Lancet (London, England), 395(10222), 450-462. https://doi.org/10.1016/S0140-6736(19)33004-1
Radua, J., Mataix-Cols, D., Phillips, M. L., El-Hage, W., Kronhaus, D. M., Cardoner, N., y Surguladze, S. (2012). A new meta-analytic method for neuroimaging studies that combines reported peak coordinates and statistical parametric maps. European Psychiatry, 27(8), 605–611. https://doi.org/10.1016/j.eurpsy.2011.04.001
Ramtekkar, U. P., Reiersen, A. M., Todorov, A. A., y Todd, R. D. (2010). Sex and age differences in attention-deficit/hyperactivity disorder symptoms and diagnoses: implications for DSM-V and ICD-11. Journal of the American Academy of Child and Adolescent Psychiatry, 49(3), 213-217. https://doi.org/10.1016/j.jaac.2009.11.011
Rubin, D. B. (1987). Multiple imputation for nonresponse in surveys (Vol. 81). John Wiley y Sons. https://doi.org/10.1002/9780470316696
Samea, F., Soluki, S., Nejati, V., Zarei, M., Cortese, S., Eickhoff, S. B., Tahmasian, M., y Eickhoff, C. R. (2019). Brain alterations in children/adolescents with ADHD revisited: A neuroimaging meta-analysis of 96 structural and functional studies. Neuroscience and Biobehavioral Reviews, 100, 1-8. https://doi.org/10.1016/j.neubiorev.2019.02.011
Sawilowsky, S. S. (2009). New Effect Size Rules of Thumb. Journal of Modern Applied Statistical Methods, 8(2), 597-599. https://doi.org/10.22237/jmasm/1257035100
Sayal, K., Prasad, V., Daley, D., Ford, T., y Coghill, D. (2018). ADHD in children and young people: prevalence, care pathways, and service provision. The Lancet Psychiatry, 5(2), 175-186. https://doi.org/10.1016/S2215-0366(17)30167-0
* Shang, C. Y., Lin, H. Y., Tseng, W. Y., y Gau, S. S. (2018). A haplotype of the dopamine transporter gene modulates regional homogeneity, gray matter volume, and visual memory in children with attention-deficit/hyperactivity disorder. Psychological medicine, 48(15), 2530-2540. https://doi.org/10.1017/S0033291718000144
* Shekarchi, B., Lashkari, M. H., Mehrvar, A., Aghdam, A. A., y Zadeh, S. F. (2014). Altered resting-state functional connectivity patterns of Several frontal and DMN related areas in children with Attention Deficit Hyperactivity Disorder. Biosciences Biotechnology Research Asia, 11(2), 761-766. https://doi.org/10.13005/bbra/1333
Simon, V., Czobor, P., Bálint, S., Mészáros, Á., y Bitter, I. (2009). Prevalence and correlates of adult attention-deficit hyperactivity disorder: Meta-analysis. British Journal of Psychiatry, 194(3), 204-211. https://doi.org/10.1192/bjp.bp.107.048827
Stern, A., Agnew-Blais, J. C., Danese, A., Fisher, H. L., Matthews, T., Polanczyk, G. V, Wertz, J., y Arseneault, L. (2020). Associations between ADHD and emotional problems from childhood to young adulthood: a longitudinal genetically sensitive study. Journal of Child Psychology and Psychiatry, 61(11), 1234-1242. https://doi.org/https://doi.org/10.1111/jcpp.13217
Stoodley, C. J. (2016). The Cerebellum and Neurodevelopmental Disorders. The Cerebellum, 15(1), 34-37. https://doi.org/10.1007/s12311-015-0715-3
Sun, R., Zhou, J., Qu, Y., Zhou, J., Xu, G., y Cheng, S. (2020). Resting-state functional brain alterations in functional dyspepsia: Protocol for a systematic review and voxel-based meta-analysis. Medicine, 99(48), e23292. https://doi.org/10.1097/MD.0000000000023292
Sutcubasi, B., Metin, B., Kurban, M. K., Metin, Z. E., Beser, B., y Sonuga-Barke, E. (2020). Resting-state network dysconnectivity in ADHD: A system-neuroscience-based meta-analysis. The World Journal of Biological Psychiatry : The Official Journal of the World Federation of Societies of Biological Psychiatry, 1-11. https://doi.org/10.1080/15622975.2020.1775889
Thomas, R., Sanders, S., Doust, J., Beller, E., y Glasziou, P. (2015). Prevalence of attention-deficit/hyperactivity disorder: a systematic review and meta-analysis. Pediatrics, 135(4), e994-1001. https://doi.org/10.1542/peds.2014-3482
Tian, L., Jiang, T., Liang, M., Zang, Y., He, Y., Sui, M., y Wang, Y. (2008). Enhanced resting-state brain activities in ADHD patients: A fMRI study. Brain and Development, 30(5), 342-348. https://doi.org/10.1016/j.braindev.2007.10.005
Tomasi, D., & Volkow, N. D. (2012). Abnormal functional connectivity in children with attention-deficit/ hyperactivity disorder. Biological Psychiatry, 71(5), 443–450. https://doi.org/10.1016/j.biopsych.2011.11.003
Tripp, G. y Wickens, J. R. (2009). Neurobiology of ADHD. Neuropharmacology, 57(7-8), 579-589. https://doi.org/10.1016/j.neuropharm.2009.07.026
van Lieshout, M., Luman, M., Twisk, J. W. R., van Ewijk, H., Groenman, A. P., Thissen, A. J. A. M., Faraone, S. V., Heslenfeld, D. J., Hartman, C. A., Hoekstra, P. J., Franke, B., Buitelaar, J. K., Rommelse, N. N. J., y Oosterlaan, J. (2016). A 6-year follow-up of a large European cohort of children with attention-deficit/hyperactivity disorder-combined subtype: outcomes in late adolescence and young adulthood. European Child and Adolescent Psychiatry, 25(9), 1007-1017. https://doi.org/10.1007/s00787-016-0820-y
* Wang, J.-B., Zheng, L.-J., Cao, Q.-J., Wang, Y.-F., Sun, L., Zang, Y.-F., y Zhang, H. (2017). Inconsistency in abnormal brain activity across cohorts of adhd- 200 in children with attention deficit hyperactivity disorder. Frontiers in Neuroscience, 11(JUN). https://doi.org/10.3389/fnins.2017.00320
* Yu, X., Yuan, B., Cao, Q., An, L., Wang, P., Vance, A., Silk, T. J., Zang, Y., Wang, Y., y Sun, L. (2016). Frequency-specific abnormalities in regional homogeneity among children with attention deficit hyperactivity disorder: a resting-state fMRI study. Science Bulletin, 61(9), 682-692. https://doi.org/10.1007/s11434-015-0823-y
* Zang, Y.-F., Yong, H., Chao-Zhe, Z., Qing-Jiu, C., Man-Qiu, S., Meng, L., Li-Xia, T., Tian-Zi, J., y Yu-Feng, W. (2007). Altered baseline brain activity in children with ADHD revealed by resting-state functional MRI. Brain and Development, 29(2), 83-91. https://doi.org/10.1016/j.braindev.2006.07.002